I am very excited to to say that the first NANOGrav paper I am on is out, and it’s a great one! It was led by Caitlin Witt and concerns the search for continuous wave (individually resolved long-lived) gravitational wave sources in the 12.5-year data.
Key figures:
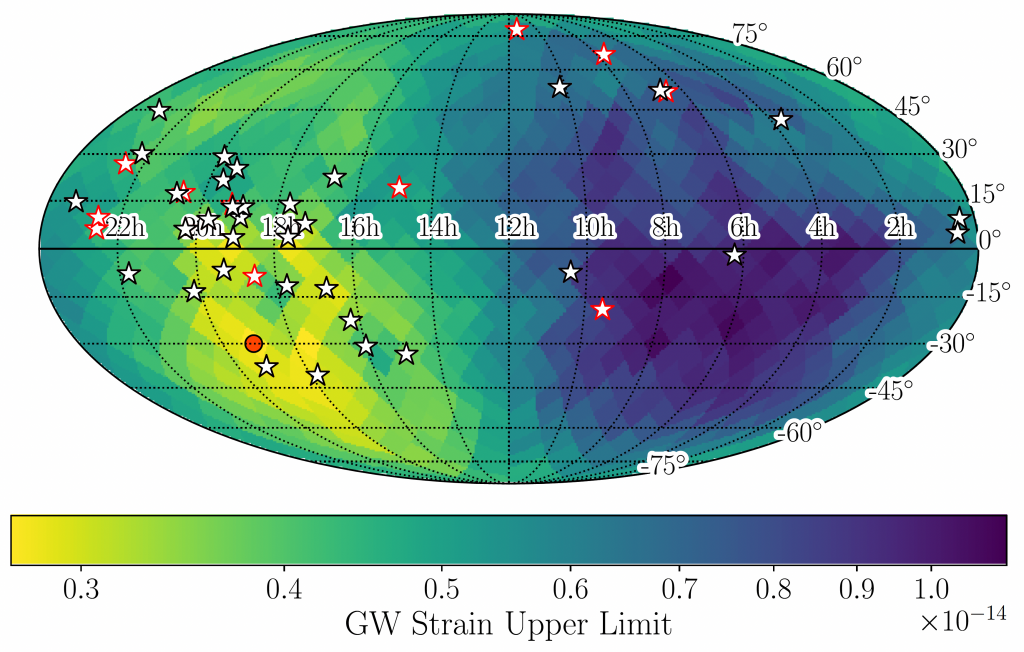
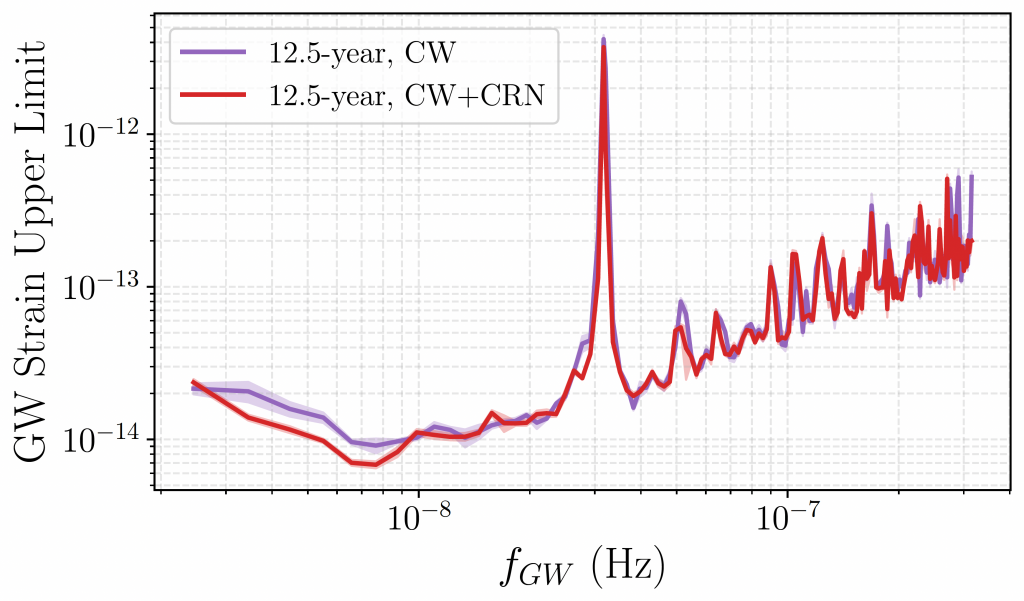
Sky map of 12.5-year NANOGrav dataset upper limits to continuous wave sources. Map of CW strain 95% upper limits at f_GW = 7.65 × 10^{−9} Hz, the most sensitive frequency searched, for the 12.5-year data set. Pulsar locations are shown as white stars, with new pulsars added from the 12.5-year data set outlined in red. The most sensitive pixel is marked with a red dot, and is located at an RA of 19h07m30s and a Dec of −30◦00′00′′. In this region, where the our best-timed pulsars lie, our upper limits are nearly an order of magnitude more sensitive than the least sensitive pixel.All-sky CW strain 95% upper limits and associated error regions, with (red) and without (purple) a CRN included in the model. At low frequencies, modeling the CRN is necessary to avoid over-estimating our strain upper limits. We are the least sensitive to CWs at fGW =1/(1 year) due to the Earth’s orbit, creating the large feature seen in this and other figures.