apjaa9064f2_hr
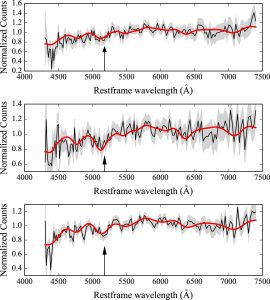
Normalized object spectra (black lines) and the 68% confidence intervals on the observed spectrum fluxes (gray shaded areas) shown for A2261 knots 1, 2, and 3 from top to bottom, respectively. The best fits obtained for each knot are shown as red lines. The arrow indicates the rest-frame wavelength of the Mgb spectral feature.